...
| Section | |||||||||||
|---|---|---|---|---|---|---|---|---|---|---|---|
|

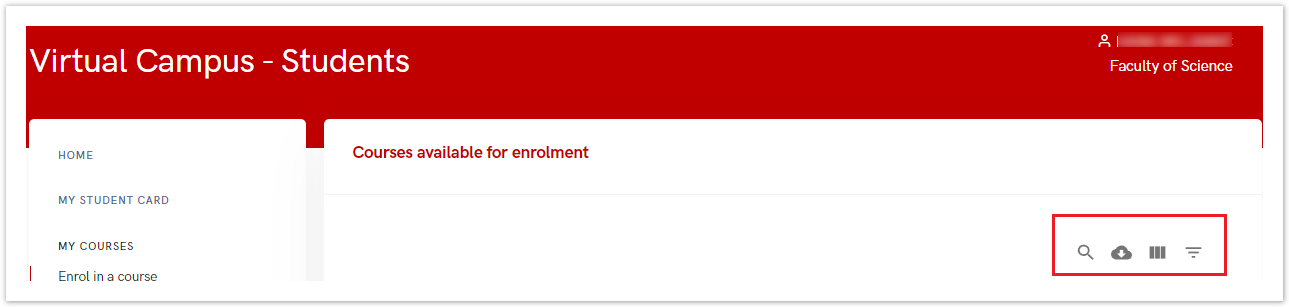
Search
This tool /option enables us to search for something in the tables.


Figure 2. Search icon
...
After selecting search, a new option opens where you can enter the text you want to search for.

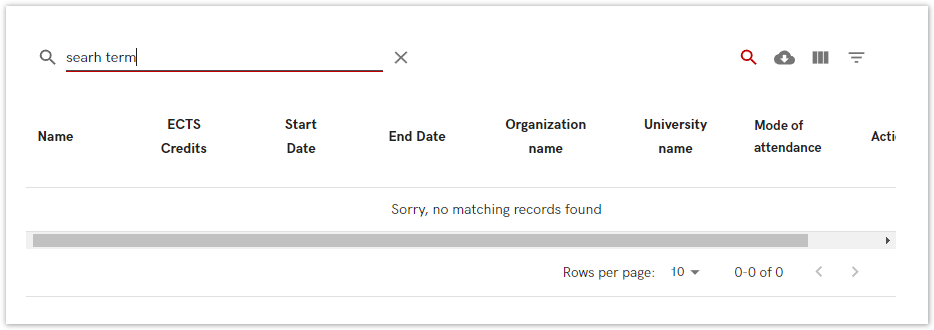
Figure 3. Search
Download CSV
Data that is shown in the table can be downloaded in csv CSV format.

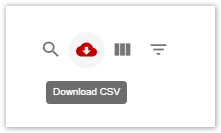
Figure 4. Download CSV icon
...
After choosing download CSV, a new windows appear window appears where you can type the name of the file, and choose where you want to download it.

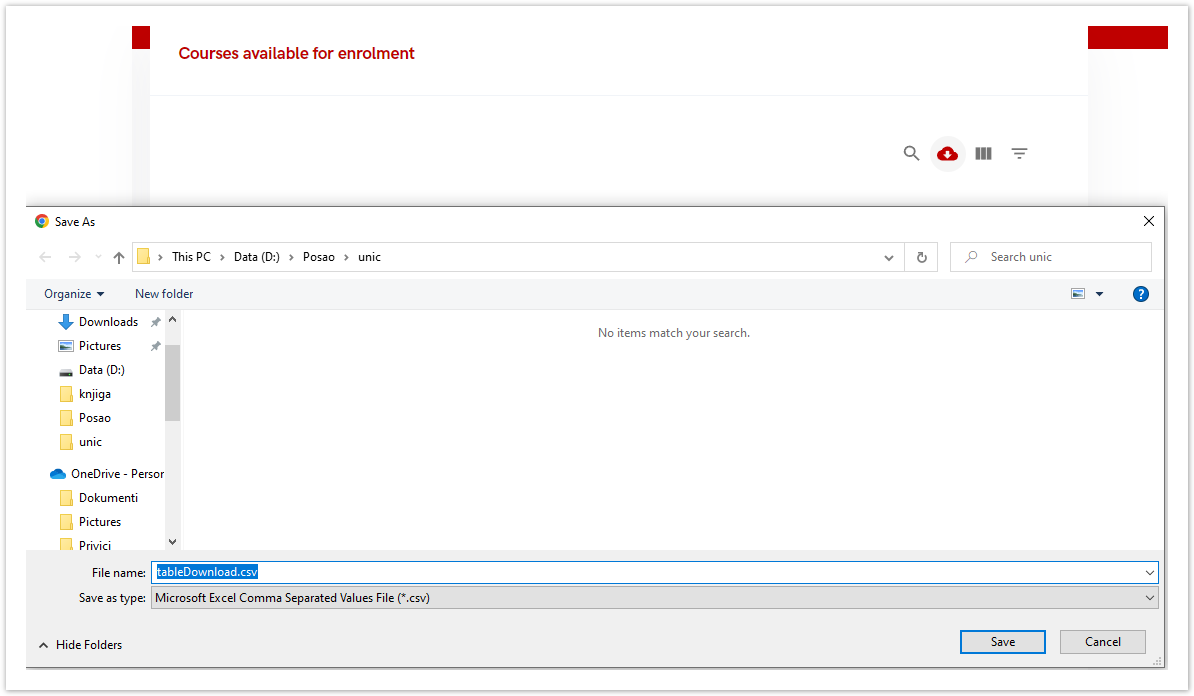
Figure 5. Downloading the csv file
View columns
This option tool enables us administrator to set which field we want to see will appear on the screen.

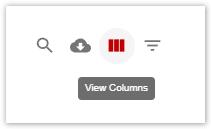
Figure 6. View columns icon
The field display depends on the selected table.
As soon as the column that you do not want to display in the report is selected, the appearance of the table in the window itself will change. Same goes the other way; if you check the empty box, that column will appear in the table.
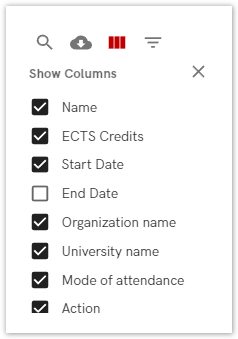
Figure 7. Choosing the columns
Filter table
The filter tool enables you to choose filters you want to set in order to find an information you are looking for. Same as in view columns option, the field display depends on the selected table.
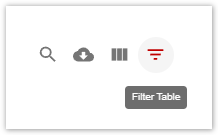
Figure 8. Filter table icon
As soon as the filter had been set, the appearance of the table in the window itself will change showing filtered results.
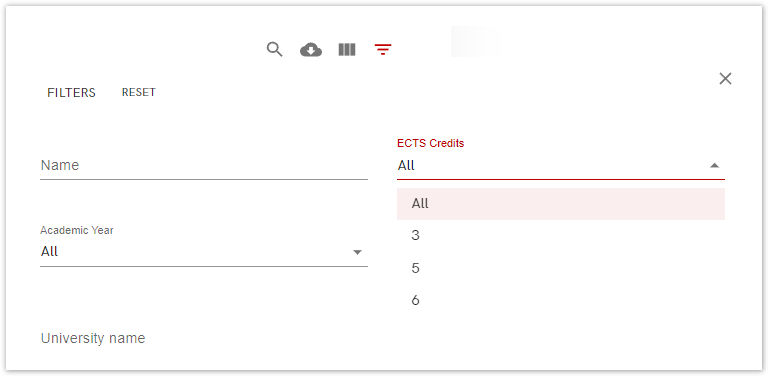
Figure 9. Filter table icon