Regardless of whether the user is a professor, university employee, or student, the tools for working with tables are the same for everyone.
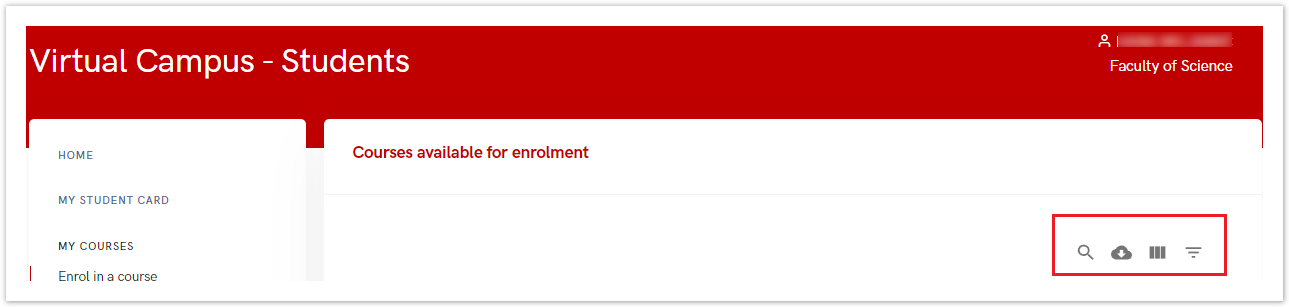
Figure 1. Tools for tables
Search
The search tool allows users to look for specific data within the tables.

Figure 2. Search icon
After selecting the search option, a new window will open where you can enter the text to search for.
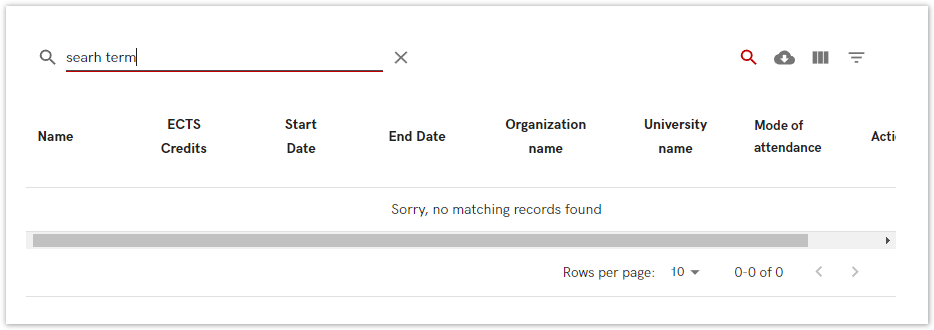
Figure 3. Search
Download CSV
Data displayed in the table can be downloaded in CSV format.
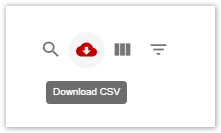
Figure 4. Download CSV icon
Once the "Download CSV" option is selected, a new window will appear, allowing you to name the file and choose the location to save it
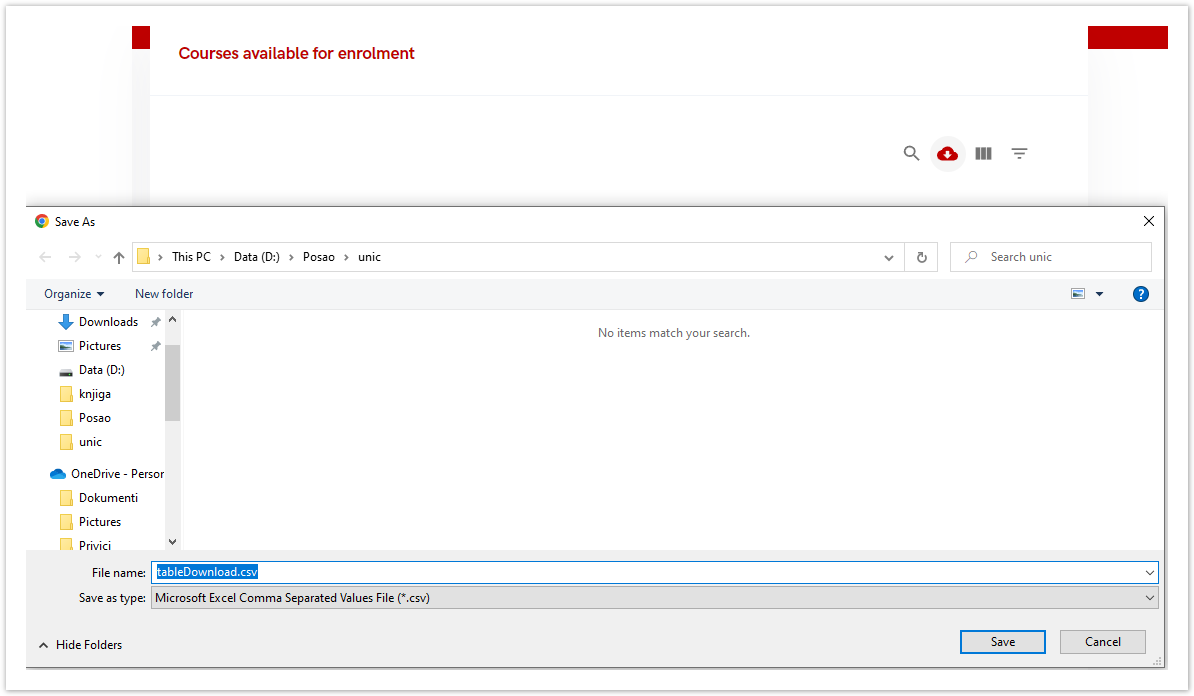
Figure 5. Downloading the csv file
View columns
This tool allows administrators to control which fields are displayed on the screen.
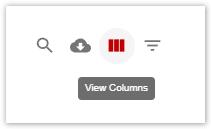
Figure 6. View columns icon
The columns displayed depend on the selected table. If you uncheck a box, the corresponding column will disappear from the table. Similarly, checking an empty box will make that column reappear.
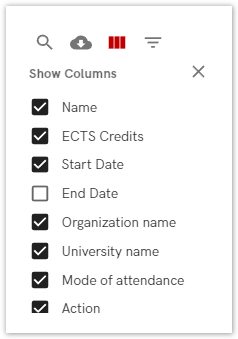
Figure 7. Choosing the columns
Filter table
The filter tool allows you to apply specific filters to narrow down the data you're looking for. As with the "View Columns" option, the fields shown depend on the selected table.
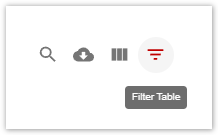
Figure 8. Filter table icon
Once the filters are applied, the table will update to display the filtered results.
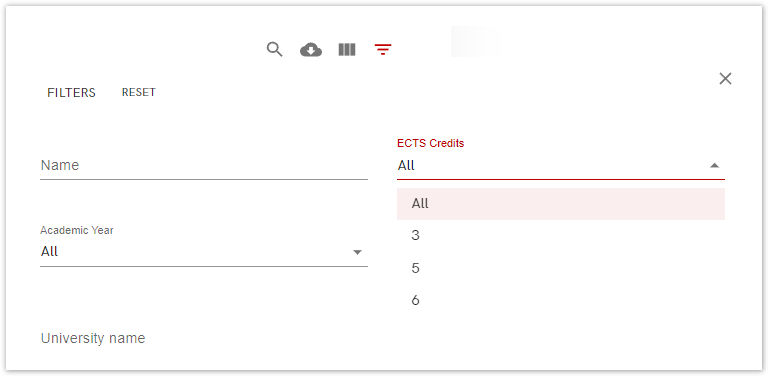
Figure 9. Filter table icon